14 Jun 2026
Global Casino Payout Trends Revealed Through Regulatory Data Archives
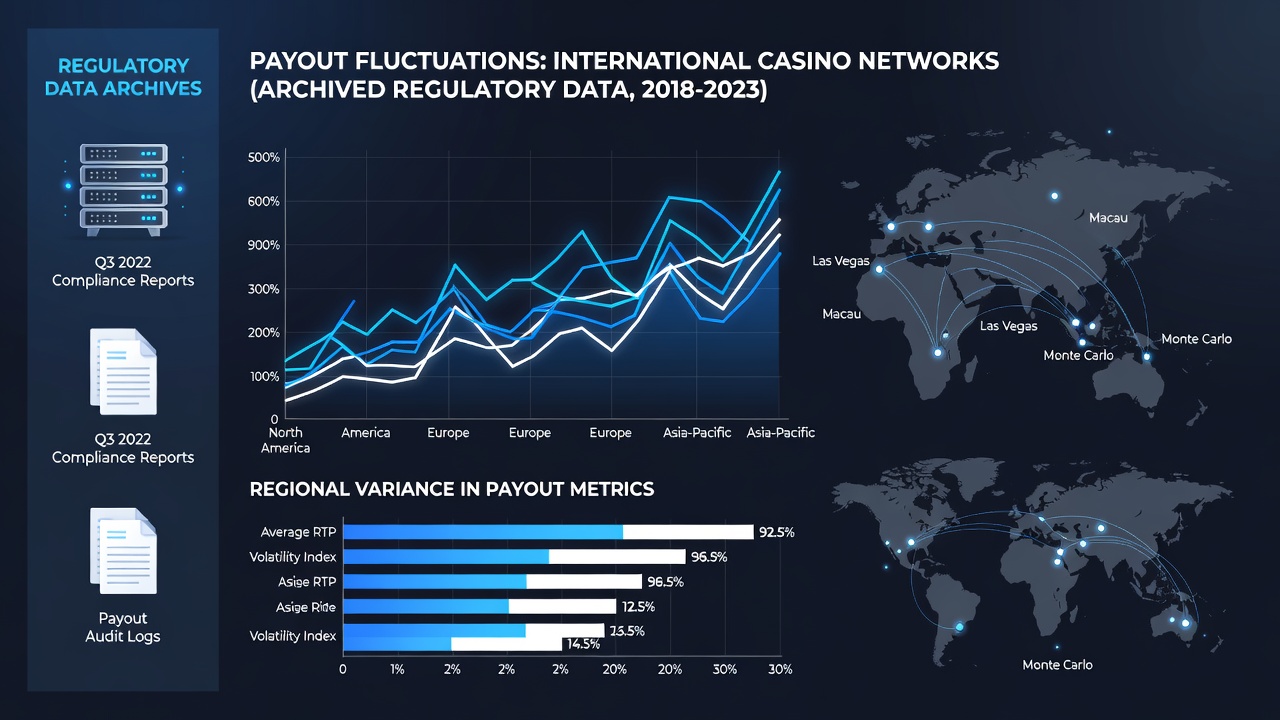
Regulatory bodies worldwide maintain extensive archives that track payout percentages and revenue distributions from casino operations, and researchers have turned to these records to map fluctuations across borders. Data compiled from licensing authorities shows how returns to players shift based on game mix, player volume, and jurisdictional rules. Analysts examine monthly and quarterly filings to identify patterns that span years rather than isolated snapshots.
Regulatory Archives as Primary Sources
Agencies in multiple regions require operators to submit detailed financial reports that include theoretical and actual payout rates for each game category, and these submissions create searchable archives that stretch back decades in some cases. Observers note that cross-referencing filings from different countries reveals timing differences in payout adjustments that coincide with regulatory updates or network expansions. The process involves extracting raw figures on hold percentages, win amounts, and coin-in totals before applying statistical models to detect deviations from expected ranges.
One study covering North American and European markets compared archived submissions from 2018 through early 2026 and found measurable dips in aggregate payouts during periods of high promotional activity, while recovery occurred once bonus structures changed. Such findings emerge only when researchers align datasets that originate from separate oversight bodies rather than relying on operator self-reports alone.
Regional Variations in Reported Payouts
North American regulators publish aggregated data that allows year-over-year comparisons across state lines, whereas Australian authorities release venue-specific reports that highlight differences between urban and regional sites. Canadian provincial commissions contribute additional layers by breaking out electronic gaming versus table game contributions, and analysts combine these streams to trace how international networks adjust machine configurations in response to local tax regimes. Evidence from these combined archives indicates that networks operating in multiple jurisdictions often maintain payout targets within narrow bands yet still exhibit short-term swings tied to seasonal tourism or new game launches.

By June 2026 the accumulated datasets included several full reporting cycles from post-pandemic recovery periods, and researchers observed that certain networks restored earlier payout levels more quickly in markets with lighter tax burdens. Archived records from the Nevada Gaming Control Board, for instance, provide granular slot performance metrics that complement broader European summaries available through industry research portals such as those maintained by the European Gaming and Betting Association.
Analytical Methods Applied to Archived Data
Statisticians apply time-series analysis and regression techniques to the archived figures, testing whether observed fluctuations exceed normal variance thresholds. They segment data by operator size, game type, and network affiliation before running comparative tests across jurisdictions. The resulting models help isolate external factors such as currency fluctuations or changes in player demographics that archived filings capture indirectly through revenue and payout totals.
Academic papers published by university research groups have demonstrated that combining regulatory archives with public financial disclosures produces more robust estimates of network-wide payout behavior than any single source alone. These studies typically anonymize individual properties while preserving aggregate trends, which allows for broader geographic coverage without breaching confidentiality rules.
Challenges in Cross-Border Data Comparison
Differences in reporting formats, fiscal calendars, and game classification systems create obstacles that analysts address through standardized mapping protocols. Some jurisdictions report theoretical return percentages while others emphasize actual outcomes, and reconciling these requires careful alignment of definitions before trend analysis begins. Despite such hurdles, the growing availability of digitized archives has reduced the time needed to assemble multi-country datasets from months to weeks.
Conclusion
Archived regulatory data continues to serve as a foundational resource for understanding payout fluctuations across international casino networks, and ongoing digitization efforts promise even wider access in coming years. Researchers who systematically combine records from diverse oversight bodies gain clearer views of how operational decisions translate into measurable return variations over time. The approach yields objective benchmarks that reflect actual market conditions rather than promotional claims.